Identify the visual before practising a sub-skill.
The response structure changes with the input: a line graph requires trend language, a table requires grouping, a process requires sequencing and a map requires spatial transformation. This guide connects the official IELTS format with the WeLearn teaching strategy.
Line graph
Changes over time
Overview: Look for the dominant trend, line crossing, peak, fall or convergence.
Body: Group the timeline into meaningful periods: start, rapid change, stability or finish.
rose steadily, peaked at, declined gradually, overtook, remained stable
Practise this visual type →Bar chart
Comparisons between categories
Overview: Look for the highest or lowest category and the clearest contrast.
Body: Group similar categories instead of describing every bar separately.
higher than, whereas, considerably lower, the largest proportion
Practise this visual type →Pie charts
Parts of a whole
Overview: Look for the dominant segment and distribution changes when two charts are shown.
Body: Compare large and small proportions without listing every slice.
accounted for, made up, represented, the smallest share
Practise this visual type →Table
Dense row-and-column data
Overview: Look for extremes, row or column patterns and categories that form groups.
Body: Turn the table into two logical groups before writing.
the figure for, respectively, by contrast, across all categories
Practise this visual type →Process diagram
Production stages or a cycle
Overview: Mention the number of stages and whether the process is linear or cyclical.
Body: Use the passive voice and chronological order; do not invent reasons.
is collected, is heated, after this, subsequently, finally
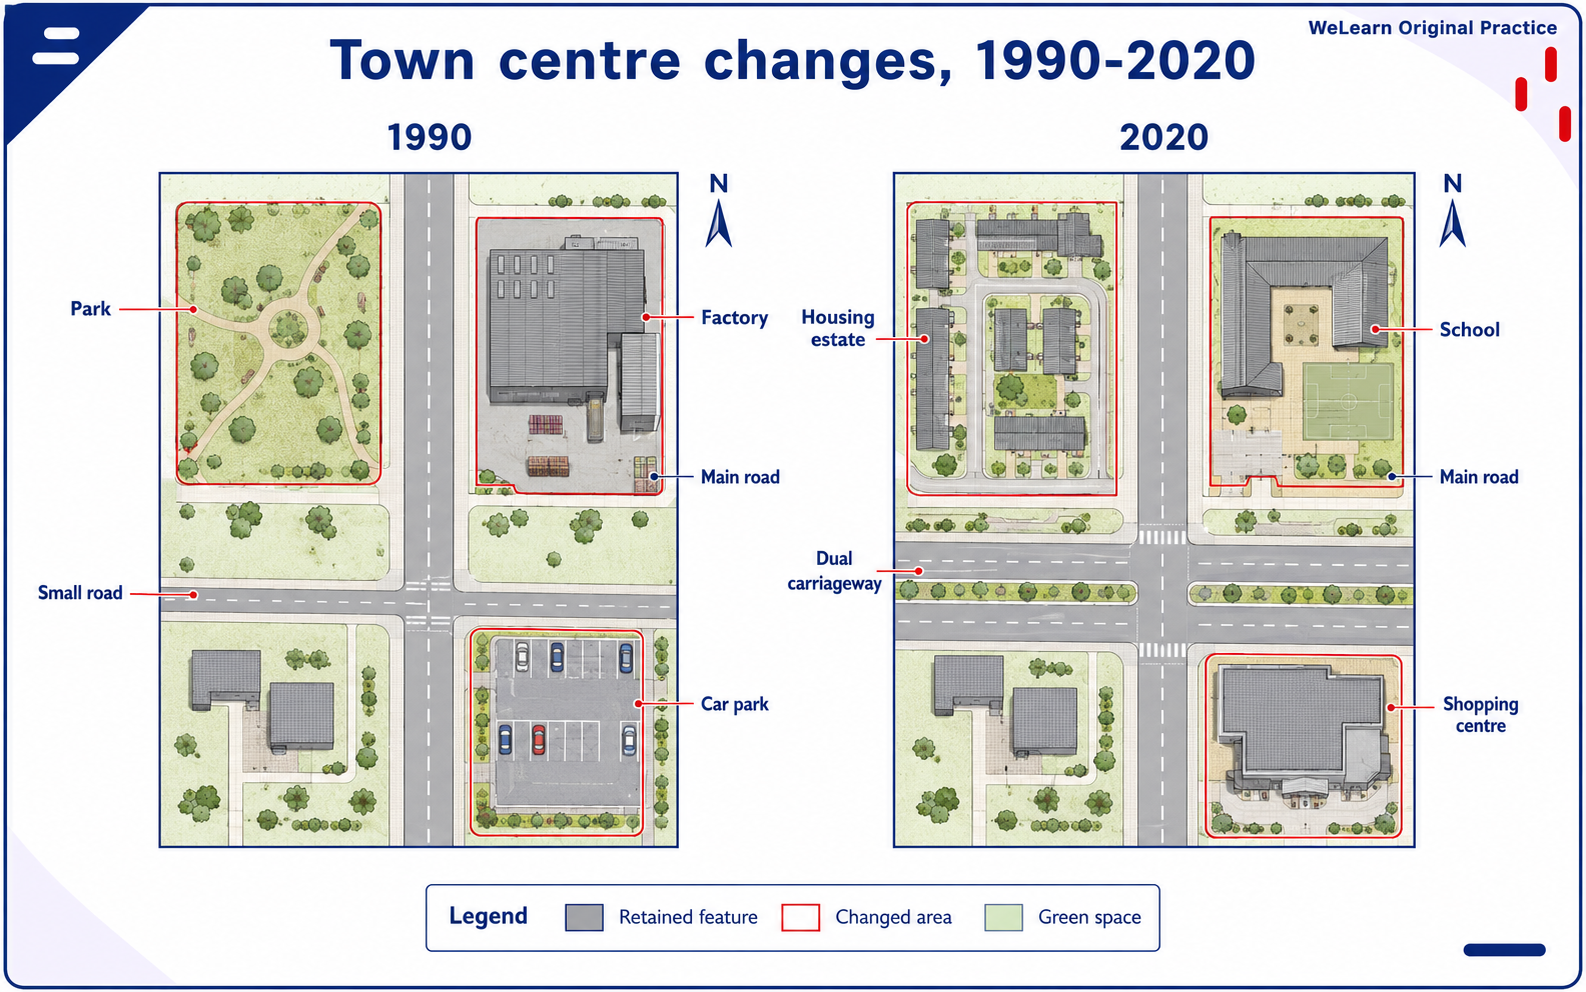
Practise this visual type →Map
Spatial changes over time
Overview: Look for overall development, replacements, expansion or reduction.
Body: Organise the response by zones or by before-and-after changes.
was replaced by, was converted into, to the north of, adjacent to
Practise this visual type →Mixed chart
Two connected visuals
Overview: Find the relationship between the visuals instead of treating them as separate tasks.
Body: Use one paragraph per visual or group them around a shared relationship.
while, in relation to, this corresponded with, a similar pattern
Practise this visual type →